The case for Dividends

The Case for Dividends

Would it not be good to get this kind of a message on your phone?  This is the message you get when the dividend gets credited to your account.

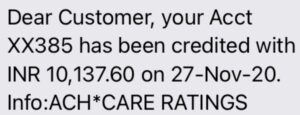
Welcome to harnessing the power of dividends as an additional source of Income.

Mukesh Ambani, Narayana Murthy, The Mahindras, Azim Premji, The Government of India itself get massive amounts of dividend income year after year on their Shareholdings in their iconic companies.

You can also build a steady stream of dividend income over a long period of time. Read on.

In these days where unemployment rates are on the rise and the incomes from salaries and rents have dwindled on account of unprecedented levels of pay-cuts and layoffs , it would be a great source of relief if you could build secondary sources of Income.

Also, as you age and get older, finding gainful sources of employment would become even more difficult. Building a portfolio of high dividend paying stocks over a long period of time would provide you with passive income during your twilight years.

This is where the dividends from your investments can help. Dividends provide a free and a continuous stream of income over long periods of time. Your retirement will be funded by the dividend income from your investments long after you have stopped working.

Dividends are a portion of profits made by the company that are paid out to shareholders every year or twice a year or multiple times of years depending on the dividend distribution policies of the dividend paying companies.

To become entitled to receiving dividends all one has to do is to open a demat account, buy shares of dividend paying companies and hold them at the time when the companies declare dividend. The dividend income would automatically get credited to your bank account within one month (as per law) from the date the dividend is declared by the company.

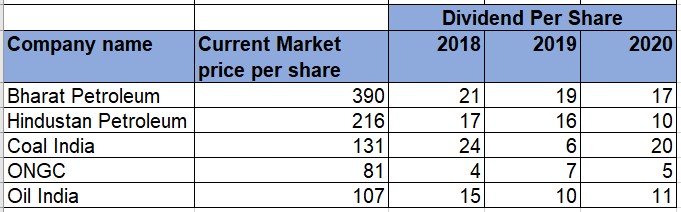
Besides, All Public Sector Enterprises (PSEs) in India have been mandated by the Government of India to pay 30% of the profit after taxes or 5% of Net worth whichever is higher as dividends to their shareholders. That is why the PSEs in India dole out huge dividends year after year. These companies which includes such big names as Bharat Petroleum, Hindustan Petroleum, ONGC, Coal India, Oil India etc., pay huge dividends. (Look at the table below in this article).

You can buy the shares of these companies especially when these are available at lower prices to become entitled to dividends almost indefinitely over long periods of time.

There are several Private Sector companies too, which pay out handsome dividends every year/twice a year.


Dividend Yield is calculated as Dividend Per Share divided by the Market Price of share at which it was bought. For example, if you bought the shares at Rs.100 per share and the company declares Rs.5 as dividend, the dividend yield will be 5/100 which is 5%. Most companies keep increasing their dividends payouts every year. So, if you hold the shares for a long time, the Dividend Yield on your shares would go up without you moving even a finger and these would be much better than the interest rates that you get on your fixed deposits.

Given below is a table showing the dividends paid by some Public Sector Enterprises in the last three years.

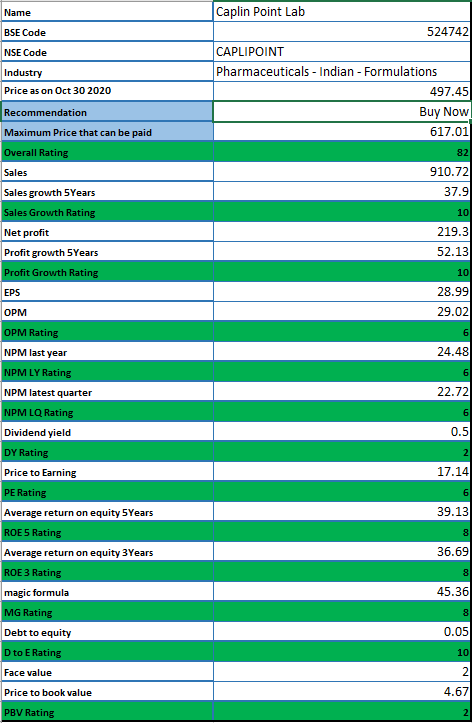
At https://Indiastockanalysis.com, we analyze and assign ratings to all stocks traded on BSE and NSE on several critical fundamental factors and also apply a margin of safety of 40% across the board to identify severely undervalued companies based on sound value investing principles. Dividend Yield is also one of the factors.

When you buy the shares of companies recommended by us , you would automatically become entitled to the dividends these companies declare as we exclude companies not paying any dividend from our analysis and ratings.

What do Value Investors do differently

At Indiastockanalysis.com we employ Value Investing principles in the analysis and ratings of hundreds of shares traded on BSE and NSE. Analysis and ratings are done by  finance professional with more than 15 years experience of investing in Indian share markets.  Our goal is help you grow your financial wealth over long periods of time.

In this article we will examine what value investors do differently.

The one thing that separates the value investors from the rest of the players in the stock market is their ability to value the business objectively based on the available information. They are more oriented towards the value of the business. The price at which the underlying stock is quoting does not matter much to them except when comparing the value to the price when making a decision about whether or not to buy the stock.

They always have a margin of safety in their investments. Margin of Safety is what protects the value investors when the markets go down or the economy suffers due to macro-economic factors. They build margin of safety into their investments. This helps them to buy the stocks only when they are quoting below the actual value of the business. This ensures that they do not lose much when the tables turn.

They are very frugal (who spend less) by nature. They live below their means and do not make a show of their wealth. Personally, they are calmer and quieter people who amass huge amounts of wealth without the world getting any inkling of it.

Value investors are avid readers. They read a lot. If their investments are in a particular company, they read and know everything about the company so much so that they have more knowledge about the company than its directors themselves. They also read a lot of the trade journals, Industry magazines, product information and everything associated with the investments that they have made.

When they make a mistake, they book the loss and go for the next opportunity. Value investors do make mistakes. When COVID 19 happened, Warren Buffet the famous value investor sold most of his holdings in the Aviation sector. Most ordinary investors sit with their losses expecting the fortunes to turnaround in the companies that they invest in even though the facts are to the contrary. For example, the investors who lost heavily in Anil Ambani group of Reliance companies still hold on to their investments in the hope that those would recover whereas, based on the current circumstances, the chances are highly unlikely. Value investors do not do that. They swallow their pride, book the loss and move on to next best opportunity.

They are willing to wait patiently until the market provides the right price. They understand the importance of waiting patiently more than any other. If the price is not right, they will not commit anything. They make a profit at the time of buying itself as they pay a very low price for their investments. They buy mostly only when the stocks are on Sale such as in March 2020 (Covid Panic driven) when almost the whole market was available on discount.

They are okay to wait in cash and not fully invested if there are no better investment options available.

They generally do not sell their investments. If the business of the company is growing, their earnings are increasing year after year, then they would not sell their investments. They continue holding their investments almost indefinitely. They sell only when the reasons on the basis of which they bought the stock do not exist anymore, when the decline in the sales and profits of the company is permanent or when there is a better alternative available for their investible funds.

They are good with numbers and are able to make a lot of calculations about value and price instantly in their minds.

They are not active in the market. For them, inaction makes more profit than constant buying and selling at every point. They don’t follow the minute to minute price movements of their holdings and are okay even if the stock market is closed for the next two years so long as the business, they invested in does well.

They buy huge quantities of shares at aggressively lower prices (only when the whole market is on Sale) or when the business of the company is grossly undervalued or a temporary bad news which drives down the market price of a wonderful company to lowest levels.

How to determine the Right Price to Pay for any Stock (Cupid Limited as Example)

(The financials of CUPID Ltd (BSE Code 530843) are used as an example here. Cupid Ltd was one of the recommendations at Indiastockanalysis.com for the month of October 2020).

Cupid Ltd has a very stable business of predominantly producing male and female condoms besides other associated gels, sanitizers and creams. It exports them to several countries in the world. It has also applied for USFDA approval to market them in the USA. The company is debt free and has recently made a foray into production of medical test kits that would facilitate diagnosis of various ailments including Covid 19 symptoms. It is a very asset light company with a very clean balance sheet and generates substantial free cash flows every year.

In this article we will discuss how to determine the price that should be paid for any stock using the principles of Value investing. Most investors identify good investments but when it comes to paying the right price most of them are found lacking in this knowledge to arrive at the right price to pay. They buy good businesses at high prices.

The price that we pay determines how well our investments will perform.

At IndiaStockanalysis.com, we identify the price to pay for all the 3000+ stocks traded on BSE and NSE. We also take caution to exclude companies whose earnings are negative.

Earnings

Earnings made by the company is one of the most significant factors that influences the market price of any stock. A business that can grow its earnings significantly over a long period of time is viewed very favorably by the market. The market rewards the earnings generating capacity of the businesses.

Therefore, in arriving at the price to be paid, earnings is the most important factor and provides the starting point.

So, what is the meaning of Earnings for determining the right price to pay for any stock. We are interested in the earnings that remain after all expenses are met and which belong exclusively to the Equity Shareholders of the company.

Excerpt from Cupid Income statement from their Annual Report

The highlighted line from the income statement above is what we are interested in. It is portion of the profit that belongs exclusively to the equity shareholders of the company. We would like to invest in a company that grows this number year after year.

And we use the TTM earnings on a Consolidated level.

TTM stands for Trailing Twelve Months. For example, if we are analyzing the stock in the month of November 2020, the TTM EPS would be the

EPS of September 2020+ EPS of June 2020+ EPS of March 2020+ EPS of Dec 2019.

For Cupid Ltd, the TTM EPS as of November 2020 is Rs.25.23

EPS Growth rate

The growth rate of a company would tell us how well the company has been able to increase its Earnings per share in the last five years. We are interested in finding companies that have been able to grow their earnings consistently over several years. 

For Cupid Ltd, here are the numbers

The compounded EPS growth rate is therefore 20.16% 

Cupid Ltd has a very stable business of producing male and female condoms. It exports them to several countries in the world. It has also applied for USFDA approval to market them in the USA. The company is debt free and has recently made a foray into production of medical test kits that would facilitate diagnosis of various ailments including Covid 19 symptoms.

EPS after three years

The next step in the process is to estimate the earnings for at least next three years using the growth rate for the past five years. It is difficult to estimate which way the company would go after three years. For our analysis, three years is the long term. We can adjust this as we move forward.

Do not worry now about this estimate. We will apply a Margin of Safety (one of the most important principles of Value Investing) to the final price that we should be willing to pay for this stock.

SO the EPS of Cupid Ltd after three years in 2022-23 would be Rs.51.82.

This is nothing but the TTM EPS compounded at the rate of 20.16% for three years.

Market Price after three years

This will be the EPS after three years multiplied by the current Price Earnings multiple (PE) for the stock.  You can get the current PE multiple of the stock from the BSE website.

Current PE is 8.96.

Alternatively, we can also calculated the PE as the average of 52 week high and low prices divided by the TTM EPS in which case it would be ((295+115)/2) Divided by 25.23 which would be 8.12. However, we take the Current PE ratio.

Therefore, Market price of the Share after three years in March 2023 is likely to be 51.82 times 8.96 which is Rs. 464.

15% minimum expected return


As value investors, we would need at least 15% after tax return on our investments.

Now we estimate, how much should we pay now, so that at a compound rate of 15% per annum it becomes Rs.464 after three years.

At IndiaStockANalysis.com, we perform these calculations for all stocks traded on the BSE and NSE stock exchange so you don’t have to do it.


For Cupid Ltd, the Price that we should be willing to pay that would amount to 464 after three years is

464/1.15/1.15/1.15 which is Rs.305.

Rs.305 invested now grows to 464 @15% rate per annum.

Margin of Safety 

We should never pay a high price for any stock. So we will NOT pay Rs.305 for it.

This is the bottom line of all value investing principle. NEVER NEVER NEVER Overpay for any stock.

The above is a good estimate but it is an estimate nonetheless. The numbers that we expected might change over the years. Therefore, we want a good margin of safety of at least 40% should something go wrong with our estimates.

For class A group stocks, we have less margin of safety of 30%.

So, the price that we should be willing to pay is Rs.305 times 0.60 which is Rs.183.

Rs.183 is the maximum price that we should be willing to pay for this stock.

What next

But Cupid is now going at 225 as at the time of this writing. So, should you buy Cupid.

The answer is a resounding No. We should not be willing to pay anything more than 183 for that stock. When it comes to 183 or thereabouts, buy a huge quantity of shares in it – Buy a part of the business if you like their business. Make your research efforts pay.

Add this company to your watchlist and keep monitoring it until it reaches Rs.183 and when it gets there make a BIG investment and have the courage to hold it for next three years. This is how real wealth is created from the stock markets. Besides, you will also be rewarded with the dividends that this company pays over these years. Currently, Cupid pays a healthy dividend of around Rs.4.50 per share.

This courage to hold comes from conviction in our analysis.

Once you buy the shares, monitor the company like a Hawk. Read every announcement that it makes, pour over its quarterly results, Read the earnings call transcripts, Understand the quarterly financial statements and see the trends and decide whether the company still has all the characteristics intact that made it to the Buy list now. 

At Indiastockanalysis.com, we help you identify the Right Price to pay for all Profit making stocks that trade on the BSE and NSE. We also rate stocks based on several fundamental parameters. Cupid was the fifth best stock in our October 2020 recommendations.

Happy Investing.

Analysis of Caplin Point Labs

October 2020 Reco- Caplin Point Labs


Here is a snapshot of Caplin Point Labs and its rating and analysis

Out of the 3000+ companies analyzed for the month of October 2020, Caplin Point Laboratories has stood out as one of the buy recommendations based on our analysis and comprehensive rating system. We recommend 10 such stocks every month which excel on all identified parameters. These stocks can help create sizeable wealth if held for a minimum of three years at the least.

What follows below is an explanation of why this company was chosen for a “Buy” recommendation in the month of October 2020.

You can scroll all the way down to read the conclusion 🙂

About Caplin Point Labs

Caplin Point Laboratories Limited is possibly the only mid-sized company in India’s pharmaceutical sector to be engaged in the manufacture of APIs, finished formulations, research & development, clinical research, frontend generic presence in Latin America, brand marketing in Francophone Africa and a USFDAapproved injectable facility.

The Company’s asset-light marketing business model has helped generate the resources to build world-class infrastructure.

The Company’s debt-free and cash surplus situation positions it attractively to address the opportunities of the future.

Sales Growth Rating (10/10)

Sales have grown at a CAGR of around 38% in the last five years. The TTM (Trailing Twelve Months) sales as at the time of this recommendation was Rs.911 crores.

At IndiaStockAnalysis.com, we give a maximum rating of 10 for sales growth greater than 30% in the last 5 years. So this company got a rating of a perfect 10.

Net Profit growth rating (10/10)

The Net profit has grown at a CAGR of 52% over the last five years. The TTM net profit as at the time of this writing was Rs.219 Crores.

We give a high rating of 10 to companies where the net profit has been showing a steadily growing pattern over the years. Therefore, on this front, this company gets a full rating of 10.

Operating Profit Margin (OPM) rating (6/10)

The Operating profit margin of the company has been around 30 to 33% in the last five years. It gets a rating of 6 on this parameter. Operating profit represents earnings before finance charges, taxes , depreciation and Amortization. This explains how well the company has been able perform on an operational basis to maintain or grow its Gross profit margins.

Net Profit Margin Last Year and Latest quarter rating (6/10)

The Net profit is what is available to the shareholders of the company after all the expenses have been paid out. The higher the net profit margin the better it is for the shareholders. At IndiaStockAnalysis.com, we shortlist only those companies that have at least 8% as Net profit Margin. On this front, this company gets a rating of 6 out of 10. It has been maintaining a healthy net profit margin of over 20%.

Dividend Yield (2 /10).

Even though this company is cash rich and is debt-free, it is not known for paying generous dividends. The company has retained cash for expansion and acquisition purposes. In the year 2020-21 , it has paid a dividend of Rs.2.50 so far. However, one thing to note is that the dividend per share is showing an increasing trend (from Rs.1.50 in 2017 to Rs.2.50 in 2020-21).

Price to Earnings Rating (6/10)

Price to Earnings measure how expensive the company is when we compare its Earnings per share against its Market price. For this company, the PE ratio is around 17. Considering the fact that this company has been growing its Sales and Net profits at a considerable pace, on the PE ratio front, it gets a rating of 6. Companies with lower PE ratio get a higher rating.

Return on Equity for 5 and 3 years Rating (8/10)

Return on Equity measures how well the company is able to use its Equity resources to earn profits for the Shareholders. In order to get a good grip on the return on Equity we measure both Average return on Equity for 5 years and also for the last three years. The higher the return, the higher the rating. Caplin Point has a rating of 8 on this front.

Magic Formula (8/10)

Magic Formula is a concept popularized by Joel Greenblatt in his famous book The Little Book That Beats the Market. This is a combination of Earnings Yield and the Return on Capital Employed. In effect, this ratio tells us how well the company has been employing its capital (both Equity and Debt) to generate profits for the Shareholders.

On this front, it has a rating of 8 out of 10.

Debt to Equity (10/10)

At Indiastockanalysis.com, we do not favor companies that employ excessive amounts of debts (both long term and Short term) on their balance sheet. We give a very low rating to companies with High Debt to Equity. Caplin Point has no debt on its balance sheet. Therefore it gets a rating of 10 on 10.

Price to Book Value (2/10)

The market price to book value per share measures the Market price against the Intrinsic worth of the company. However, this is a traditional measure. Book value is not fully representative of the real realizible value of the assets/liabilities of a company. However, at Indiastockanalysis.com, we favor companies and highly rate the ones that have low Price to Book Value. On this front, Caplin point scores 2 out of 10.


Conclusion

So this stock of Caplin Point Laboratories has an overall Rating of 82 out of 100. It is no doubt a wonderful company. But is the price attractive enough to buy this.

At Indiastockanalysis.com, our objective is to identify wonderful companies and MORE IMPORTANTLY to recommend buying them at attractive prices.

So should you go and buy it. No. Not until you know what is right price that can be paid for it.

This is where most investors make mistakes. Most of them do not know what is the right price to pay for the stock.

But we will help you find this.

Caplin Point’s EPS as at the end of March 31, 2020 is Rs.26.13

Its Average rate of Return on equity has been around 35% in the last five years.

Assuming it can grow it at the same rate over the next three years (do not worry we will also add Margin of Safety and that should take care if our assumptions go wrong), its EPS in March 2023 would be

26.13 times 1.35 raised to 3 which is Rs.64.

The Current PE ratio for this company is 17.

At this PE, at the end of March 2023, this company will be quoting at 64 times 17 around Rs.1088.

If our objective is to earn 15% return for the next three years , we should be willing to pay nothing more than Rs.715 (that is the present value of Rs.1088 discounted at 15% for three years).

Lets add a Margin of Safety of 30% to this price, so we get a price of Rs.500.

Rs.500 is the right price to pay for this stock to earn a rate of 15% return at a margin of safety of 30%